
Top Free Tools for Mobile App Performance Testing in 2025
Your mobile app development process does not stop at deployment. Rather, it is an ongoing journey with continuous performance testing, maintenance, and updates for long-term success. Here, we provide you with top free tools for simplifying such processes.
Content Map
More chaptersThe trend of mobile-first has contributed to a lucrative mobile app market. According to Statista, consumer spending on mobile applications in 2024 increased to 36.2 billion U.S. dollars (equivalent to 12%) compared to the corresponding quarter in 2023.
Success in this industry nowadays is no longer simply a story of innovative project ideas, but a battle of quality products. With mobile applications, quality is largely determined by its performance, in the long term rather than day one and two. One of the best ways to control performance metrics is through rigorous mobile app performance testing.
You may think of performing such a task through manual methods, trying accessing different features while connected to slow internet, for example. However, to truly assess app performance at scale, where testing across all devices, under load, and over time is required, using testing tools is an optimal choice.
If you are unsure which tool to pick and prefer not to spend money on something uncertain, let’s begin with these free mobile app performance testing tools first!
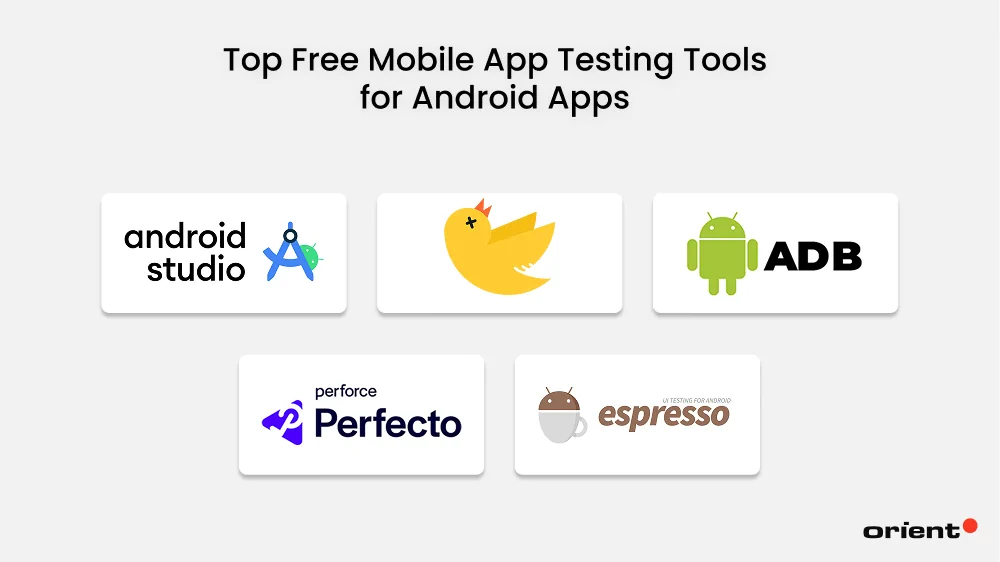
Top Free Mobile App Testing Tools for Android Apps
Here is the list of top free performance testing tools across different operating systems:
1. Android Profiler (Android Studio)
Android Profiler, or what we call Android Studio, is a real-time performance analysis toolset embedded directly in Android Studio and is designed specifically for performance testing and tuning Android applications during the development process. Developers can use Android Studio to evaluate the performance of metrics, including CPU, memory usage, network performance, battery usage, and rendering of a given Android application.
With a pre-built APK profiler, Android Profiler allows users to debug and profile the APK without having to build it by using Android Studio. The tool also has the ability to record different sessions and switch between them to facilitate comparison of mobile devices’ performance under various scenarios.
- What Android Profiler does: Provides live tracking of CPU, memory, network, and battery usage.
- How Android Profiler works: Integrated directly into Android Studio.
- Android Profiler is best for: Detecting rendering lags, slow method calls, network spikes, and memory leaks during development.
- Bonus: Allows real-time inspection without needing external tools.
2. LeakCanary
LeakCanary is a free, open-source memory leak detection tool developed by Square for Android apps. To use LeakCanary, users first need to integrate the tool into their Android project. Once integrated, LeakCanary immediately does its thing: monitors your app’s memory and alerts you when it detects leaked objects that are no longer needed but not garbage collected. Instead of manual processes, LeakCanary is the right solution to help Android developers automate the phase of memory leak detection on their applications during development and testing before they reach real users.
- What LeakCanary does: Automatically detects and logs memory leaks in real time.
- How LeakCanary works: Embedded in your app as a library.
- LeakCanary is best for: Early detection of memory inefficiencies that can lead to crashes or slowdowns.
3. ADB Tool (with dumpsys, systrace)
ADB Tool (with dumpsys, systrace) is a command-line tool provided by Google as part of the Android SDK. While not strictly a performance testing tool, it is an essential component of the Android development and debugging ecosystem that is commonly used in various aspects of testing, including system-level testing.
By leveraging ADB Tool, software developers can communicate with Android devices or emulators for a wide range of operations, from installing apps to accessing logs and monitoring system performance. Unlike Android Profile, ADB Tool has no graphs or timelines available to watch real-time charts on a dashboard, but gives you text-based snapshots of data like numbers, logs, and system dumps.
- What ADB Tool does: Offers deep command-line access to system stats like CPU, threads, battery, and UI responsiveness.
- How ADB Tool works: Use adb shell dumpsys and adb shell top to collect low-level metrics.
- ADB Tool is best for: Advanced diagnostics, especially in production-like environments or on physical devices.
4. Perfetto
Perfetto is not primarily a performance testing tool. However, it still offers users the ability to trace and analyze low-level performance data (in the sense of load or stress testing). When used in conjunction with other “real” testing tools, Perfetto is at its most effective.
Perfetto, in simple terms, is an open-source system profiling and tracing tool designed specifically for Android apps (and also Linux-based software). Instead of providing traditional features for measuring the performance of a given application, Perfetto captures, analyzes, and visualizes system-level and app-level performance data, helping development teams understand clearly how and why a performance issue happens. The software is completely free (open source by Google) and ideal for engineers needing insight into how Android apps and the OS behave under load.
- What Perfetto does: Captures system-wide trace events for end-to-end performance analysis.
- How Perfetto works: Launch tracing sessions on the device and export trace data using the Perfetto UI in a web browser.
- Perfetto is best for: Deep performance analysis across complex rendering and scheduling paths.
5. Espresso (with performance traces)
Espresso, developed by Google, is a UI testing framework for Android applications. While Espresso itself is not used to automate different performance testing types, such as load and stress testing, developers can still capture performance data during Espresso test execution by pairing it with other tools like Perfetto, Firebase Performance Monitoring, and Systrace.
Imagine you are testing a login screen using Espresso. As a testing tool for UI behavior, Espresso helps users check whether the login button of the app works properly, rather than telling you whether the login feature takes too long. This is just one of the applications of Espresso in mobile app performance analysis. Overall, Espresso (with performance traces) is a great choice for automating user flows and measuring performance bottlenecks in the same run.
- What Espresso does: Enables automation of UI tests and measuring app responsiveness via instrumentation tools.
- How Espresso works: Use Espresso tests together with command-line tools like Android Profiler or systrace to benchmark screen transitions.
- Espresso is best for: Validating UI performance at scale across interactions and builds.
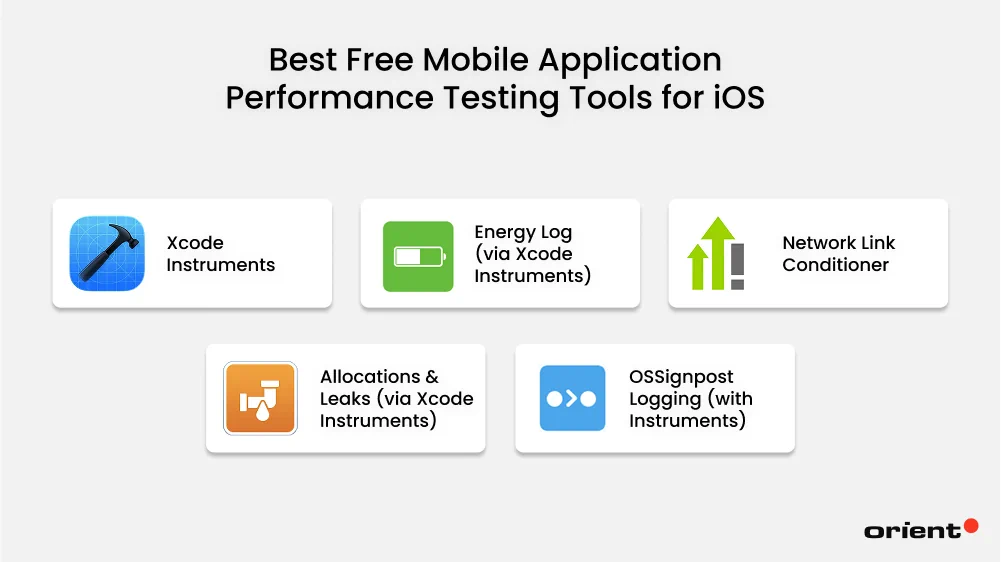
Best Free Mobile Application Performance Testing Tools for iOS
6. Xcode Instruments
Xcode Instruments is a powerful performance analysis and debugging tool and a part of the Xcode toolset, which is the Apple’s official development environment for iOS, macOS, watchOS, and tvOS apps. With Xcode Instruments, iOS developers can perform any tasks related to app performance, from identifying performance bottlenecks and measuring system resources usage to tracing memory leaks and detecting energy consumption issues.
- What Xcode Instruments does: Comprehensive profiler for CPU, memory, rendering, network, and energy consumption in iOS apps.
- How Xcode Instruments works: Run your app via Instruments (launched from Xcode).
- Xcode Instruments is best for: Diagnosing slow methods, memory retention, UI lag, and battery drain.
7. Energy Log (via Xcode Instruments)
Energy Log is a performance analysis tool available in Xcode Instruments that is used to evaluate energy consumption during runtime of iOS/macOS apps on devices. By providing essential features that allow users to monitor things like CPU usage, networking, location services, background tasks, Energy Log is able to identify which behaviors have the highest power consumption, thereby reducing overuse and optimizing background processing.
To use Energy Log, users first need to open Xcode, then click Product > Profile > Energy Log. Once selected, you run your app through Instruments and interact with it as a normal user would. The tool will then record your app’s real-time data about energy impact and provide detailed summaries to fix inefficiencies that could affect battery life.
- What Energy Log does: Tracks your app’s battery impact.
- How Energy Log works: Accessed via Xcode Instruments.
- Energy Log is best for: Battery optimization on iPhones and iPads.
8. Network Link Conditioner
There is one important factor that developers often overlook when conducting mobile app performance testing: network conditions, or more specifically, the latency and bandwidth of the Internet connection. Experiencing a mobile app with slow load times, for example, can quickly cause users to become frustrated and impatient. Network Link Conditioner comes into such a situation.
Network Link Conditioner is a testing tool provided by Apple for iOS and macOS that allows users to perform advanced performance testing capabilities. It enables developers to throttle, delay, or corrupt their device’s network connection to mimic different realistic mobile environments. This is considered a particularly useful tool for evaluating how mobile apps behave under real-world connectivity challenges like slow Wi-Fi, limited 3G, or high latency.
- What Network Link Conditioner does: Simulates different network conditions.
- How Network Link Conditioner works: Mac system preference tool affecting connected devices or simulators.
- Network Link Conditioner is best for: Testing how your app behaves in real-world mobile networks.
9. Allocations & Leaks (via Xcode Instruments)
Allocations and Leaks Instruments are a pair of powerful performance analysis tools within Xcode Instruments. This tool combination allows iOS/macOS developers to understand how their mobile apps use memory. Is the app releasing memory properly? Are there any operational issues that could lead to memory leaks and performance issues?
While the Allocations Instrument is responsible for tracking memory allocation, which means assessing what objects your app is creating and how much memory they use, the Leaks Instrument specifically detects memory leaks that should have been deallocated.
- What Allocations & Leaks do: Track memory allocations, object lifecycle, and identify leaked references.
- How Allocations & Leaks work: Instruments visually show objects retained in memory and where leaks originate.
- Allocations & Leaks are best for: Memory optimization and crash prevention.
10. OSSignpost Logging (with Instruments)
Rather than a standalone testing platform, OSSignpost Logging is a performance analysis feature provided by Apple to help developers mark “signposts” to track the execution flow and measure performance in detail using Xcode Instruments. Specifically, OSSignpost Logging is capable of tracking the duration of animations, seeing when and how often a function is called, measuring performance across custom tasks, and then visualizing users’ own traces alongside CPU, memory, and energy metrics.
However, the tool is not suitable for cases where automatic performance profiling is required and tracking memory leaks, battery usage, or network calls is a must. OSSignpost Logging also requires various manual setups and interpretations, which are developer-intensive for functioning smoothly.
- What OSSignpost Logging does: Lets developers measure latency and duration by tagging performance-sensitive code blocks.
- How OSSignpost Logging works: Code instrumentation via os_signpost API, visualized in Instruments.
- OSSignpost Logging is best for: Custom performance benchmarking in Swift or Objective-C.
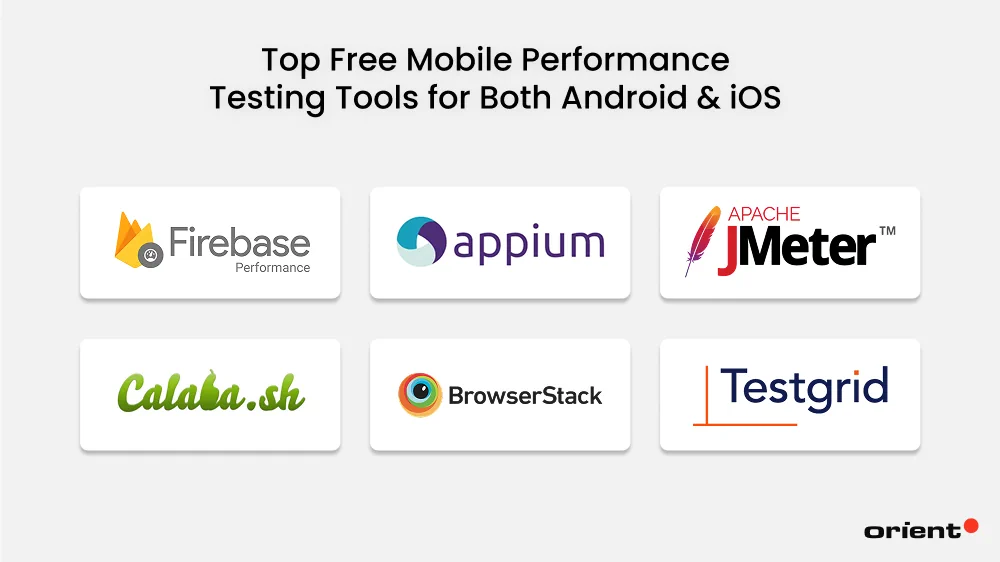
Top Free Mobile Performance Testing Tools for Both Android & iOS
11. Firebase Performance Monitoring
Firebase Performance Monitoring is a free and real-time application performance monitoring (APM) tool from Google’s Firebase platform designed to help developers understand the actual performance of a mobile app from the perspective of real users.
To monitor critical parts of an app across devices, networks, and locations, the tool passively collects performance data from real user sessions using the Performance Monitoring SDK and allows developers to customize performance tracing. By automatically analyzing data collected in the Firebase console, Firebase Performance Monitoring has the ability to detect potential issues even before users report them.
- What Firebase Performance Monitoring does: Monitors performance from real user sessions.
- How Firebase Performance Monitoring works: Integrated via Firebase SDK; collects and reports data to Firebase Console.
- Firebase Performance Monitoring is best for: Monitoring live app usage across devices, OS versions, and geographies.
Bonus: Firebase Performance Monitoring supports Flutter, React Native, and more.
12. Appium
Appium is another open-source tool to automate mobile app testing of native, hybrid, and mobile web apps operating across Android, iOS, and even Windows platforms. With cross-platform support, Appium allows mobile developers to write tests once using standard programming languages like Java, Python, JavaScript, or Ruby and run them in different platforms without having to separately modify their apps.
- What Appium does: Automates UI interactions and measures response times.
- How Appium works: Write cross-platform scripts that simulate taps, swipes, and transitions; combine with timing logs to assess UI latency.
- Appium is best for: Automated performance regression testing across UI workflows.
13. Apache JMeter
Apache JMeter is a popular open-source performance testing tool known for its robust capabilities of load testing, stress testing, and functional testing of both static and dynamic resources. Developers use Apache JMeter primarily to measure and analyze the performance of APIs, mobile applications, web apps, databases, and other services.
Some typical use cases you might consider when using Apache JMeter include testing how a certain app performs with different numbers of users, checking how long a login endpoint takes under stress, simulating slow network conditions with heavy load, measuring response time of a database query, etc.
- What Apache JMeter does: Simulates thousands of mobile users sending HTTP requests to backend APIs.
- How Apache JMeter works: Create test plans that mimic app traffic patterns (REST, SOAP); measure response times, throughput, and error rates.
- Apache JMeter is best for: Testing server scalability and identifying backend performance bottlenecks.
14. Calabash
Calabash is a cross-platform testing framework for automated acceptance testing that simulates real user interactions of native and hybrid mobile applications on iOS and Android. Unlike many other app performance testing tools, Calabash uses a behavior-driven development (BDD) approach which allows developers to write tests in plain English using a format called Gherkin (e.g., Given, When, Then), helping even non-technical stakeholders to read and understand.
However, the tool has a fatal limitation: it is no longer actively maintained, which means developers have stopped updating or supporting Calabash (official support ended from Xamarin/Microsoft in 2017). Although no longer supported, meaning no new features or further updates are available, users can still download and use it normally for basic test cases, especially on older app setups.
- What Calabash does: Automates cross-platform mobile UI scenarios and their performance.
- How Calabash works: Defines feature files and scripts (Cucumber style) and runs interactions on Android/iOS with response time logs.
- Calabash is best for: Legacy UI performance validation (but not recommended for new projects).
15. BrowserStack App Performance (free tier)
BrowserStack is a cloud-based testing feature within its App Live (manual) and App Automate (automated) platforms widely used in performance profiling of real mobile apps (Android and iOS). With the free tier, it is capable of capturing a broad range of key performance indicators such as UI rendering performance, CPU and memory usage, app startup time, battery consumption, network throughput, API call counts and latency.
The free tier of BrowserStack App Performance is available in BrowserStack’s App Live and App Automate platforms and only offers limited options for Android apps on App Automate. For iOS profiling and manual performance testing, users need to upgrade to paid tiers like Device Cloud Pro or Enterprise.
- What BrowserStack App Performance does: Provides app performance metrics on real devices across global locations.
- How BrowserStack App Performance works: Upload your app or link with CI; launch tests remotely; performance data appears in the dashboard.
- BrowserStack App Performance is best for: Testing real-device performance at scale without owning physical devices.
16. TestGrid
TestGrid is an end-to-end testing platform designed to help both software developers and QA teams test mobile apps on real devices hosted in the cloud. What is special about TestGrid is that users can use real mobile devices across operating systems to run tests and monitor the results. Its performance testing capabilities include automatic tracking of CPU usage, memory consumption, network activity, and battery drain while your app is running. The tool also integrates seamlessly with almost all leading continuous integration and delivery (CI/CD) pipelines, making it a suitable choice for agile workflows.
- What TestGrid does: Allows automated and manual testing of mobile and web applications on real devices, with built-in performance monitoring.
- How TestGrid works: Connects your apps via CI/CD, then runs tests on real Android/iOS devices in the cloud.
- TestGrid is best for: Cross-device compatibility testing and CI/CD-integrated automation.
On the whole, while mobile app performance testing can be a daunting process, with the help of the listed free tools, you can somewhat simplify such a task and free up effort for other core competencies of the project. Of course, there are many other paid tools out there that may offer you more advanced features. However, starting with a trial version of a free tool is not a bad choice. By gaining experience, you can know exactly what you need in a performance platform and make more appropriate choices in later stages/mobile app projects.